This website documents the weather in Payhembury, near Honiton, Devon. From August 2017 the weather has been measured with a Davis automatic station which feeds data onto the web (link above). Before this a Maplin weather station was used and before 2015 the Max and Min temperatures were recorded every day and tabulated in the spreadsheet (see link below) and rainfall by a rather crude rain guage. The temperature was measured by an electronic thermistor in my back garden sheltered from the wind.
See pictures of the snow in December 2010. More photos around the village here. Parish Mag Articles at tab above left.
See pictures of the snow in December 2010. More photos around the village here. Parish Mag Articles at tab above left.
|
Payhembury Temperatures
|
Payhembury Rainfall
Links to useful weather sites
For Forecasts: General site for Devon is here and rain radar to help you decide if you need a coat or to put out washing. A site to compare different forecasts is here. For Current Weather: Weather at Dunkeswell Weather in the Otter Valley and at Cullompton, Willand. A list of local weather reports in map form. Weather elsewhere in the UK and beyond from an authorative source. There are good weather graphics here. Local river levels are given here and reservoir levels here. For Past Weather go here for an archive of obs. Go here for recent severe weather events, A table comparing the weather in Honiton and Bracknell is given here. A map of lightning strikes here. For alternative weather sites see the list here and for sites with good satellite imagery click here. If you are travelling in the U.K. the google maps web site here is useful (turn on traffic option). For things extraterrestrial go here for predictions of space objects and here for space weather. Sources of energy going to National Grid right now here. |
Payhembury Sunshine (from PV cells) Plot of monthly means here.
Forecast for Payhembury click here
Floods in Feniton 13 Aug 2020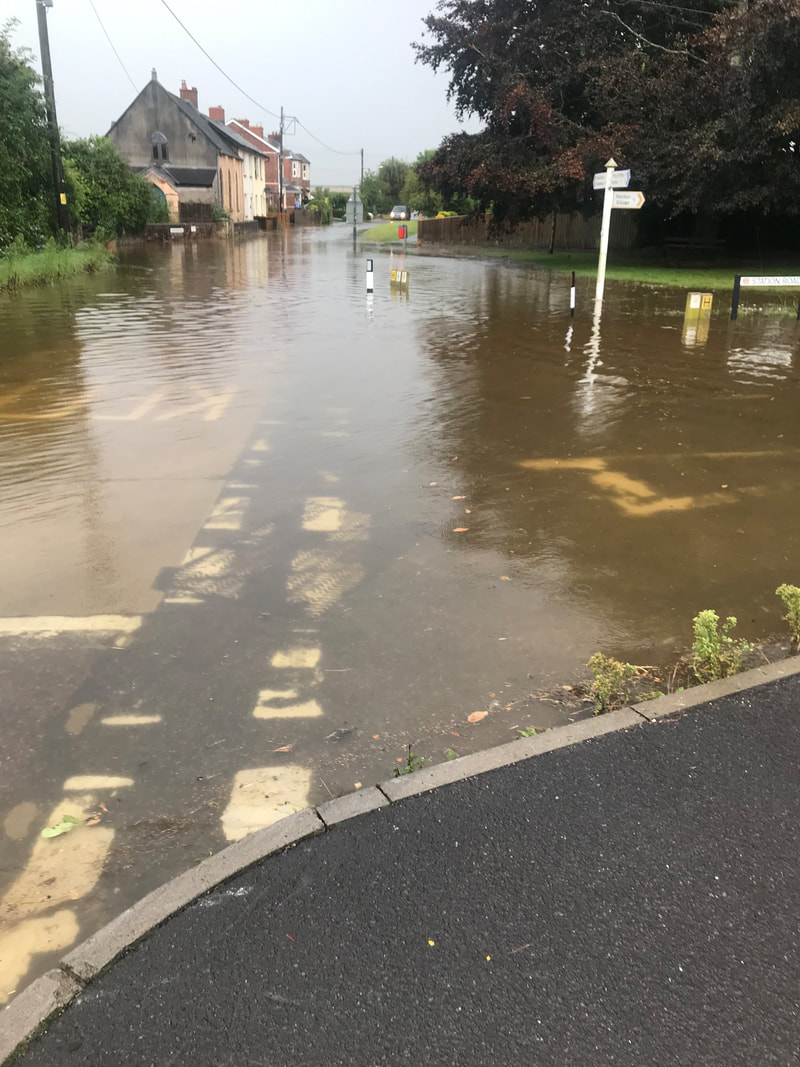
|
